Live inference · accuracy vs interpretability
Draw a digit · CNN vs Pure KAN
Same input, two stories: the CNN is usually more accurate, but opaque. The Pure KAN is a bit less accurate — and every decision edge is a plottable function φ(x).
Loading models…
Start in the dashed box above. Thick strokes work best.
CNN
Weights mix features; you mostly explain after the fact (Grad-CAM).
Pure KAN
Each edge is a learned φ(x) you can plot, prune, and symbolize.
CNN wins accuracy
Fast, local filters. The “why” of a prediction is buried in the weight tensor.
KAN wins interpretability
~5 pp less accurate on MNIST — but decisions live on univariate edge functions you can inspect.
Live KAN edges
Inspect φ(x) — click an edge
These are the same Chebyshev edge functions inside Pure KAN. After you draw, we rank edges by contribution to the predicted digit. CNN has no equivalent view.
Draw a digit to list contributing edges — or browse strongest edges.
The point isn’t beating the CNN — it’s reading the model
Pure KAN trades a few accuracy points for intrinsic interpretability: edges are functions, not black-box weights.
Why accept lower accuracy?
Interpretability you can show
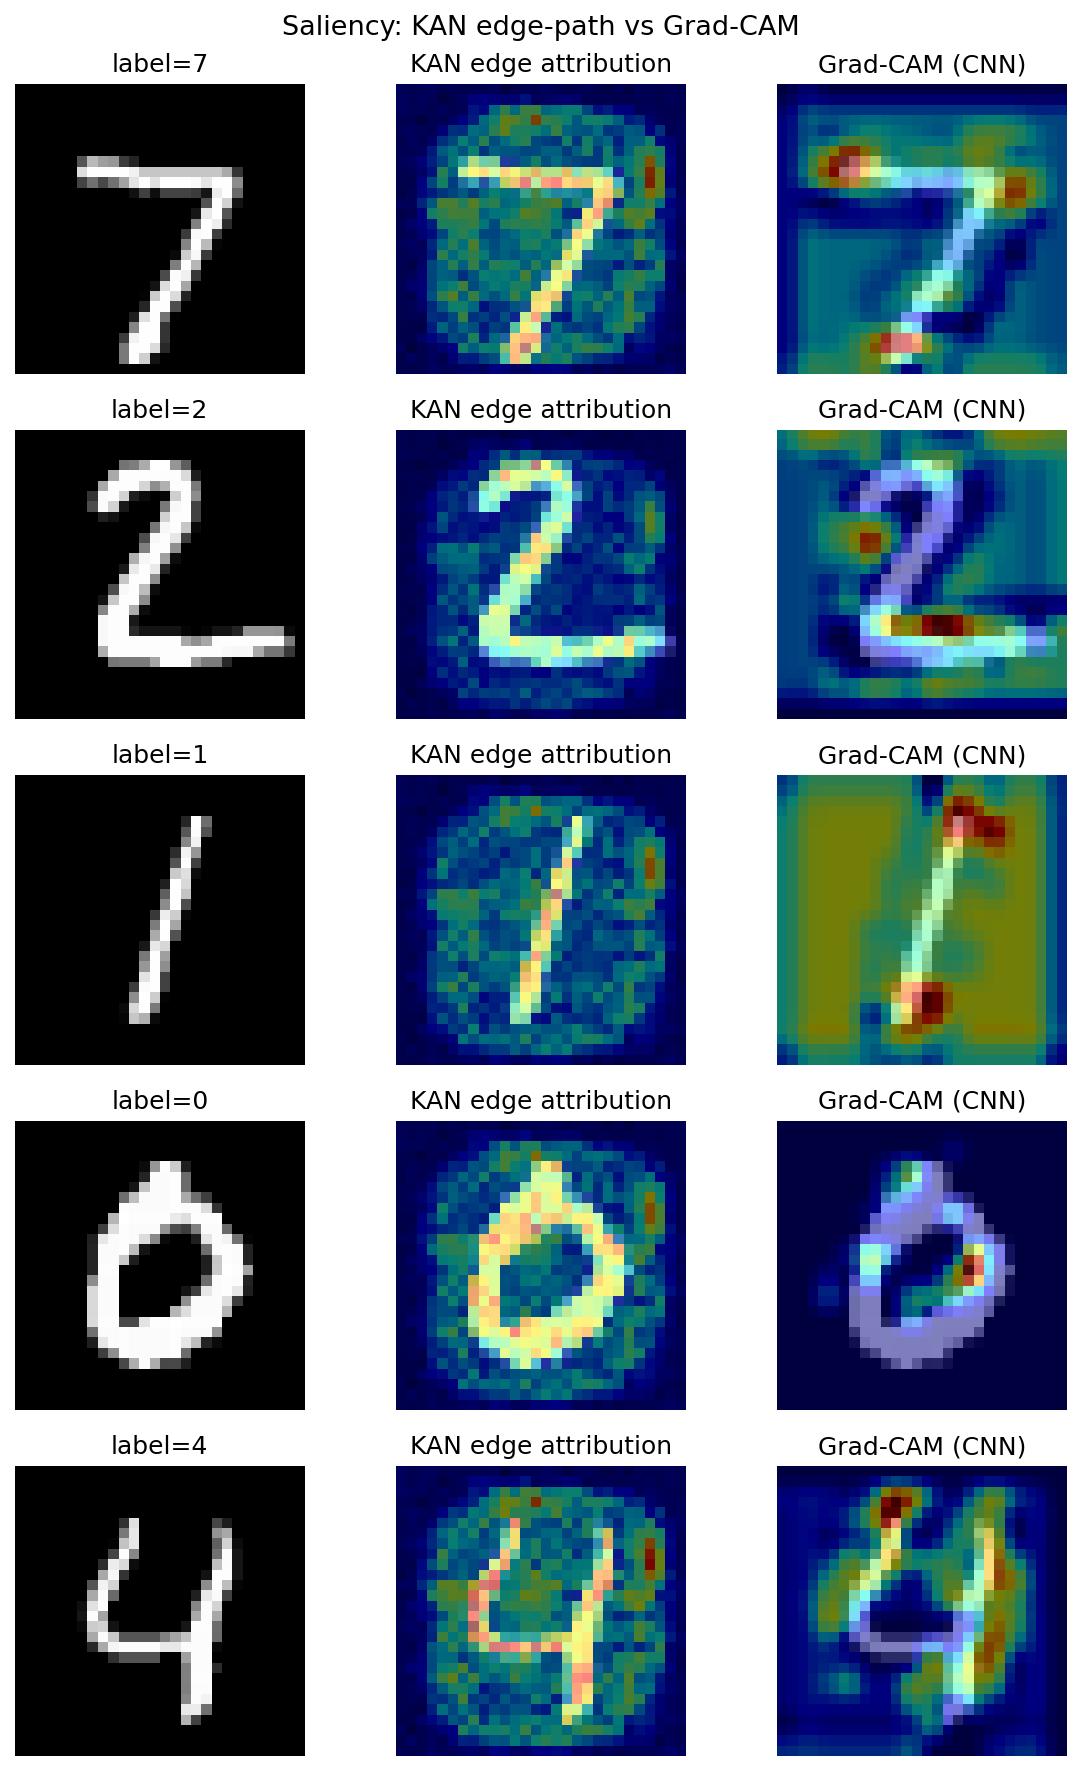
Below: the same Pure KAN behind the demo. Even when it disagrees with the CNN, you can inspect which edges mattered — something a standard CNN does not give you natively.



Results
Benchmarks
Accuracy still matters — Conv-KAN closes much of the CNN gap while keeping a readable KAN head.
Theory
Why KAN can be less accurate and still valuable
CNNs use fixed activations on nodes after linear/conv mixing. Decisions hide in large weight tensors; Grad-CAM approximates where mattered, not the functions computed.
KANs put learnable univariate φ(x) on edges: φ(x)=Σ cₖ Tₖ(tanh(x)). You can plot, prune by ‖c‖₂, symbolize, and attribute along paths — that is the product, not a side note.
CNN
Local filters, fixed σ, fast inference. Explainability is mostly post-hoc.
Pure KAN
Flattens the image; every edge is a Chebyshev polynomial — slower and a bit less accurate here, but the decision path is readable.
| Dimension | CNN | Pure KAN |
|---|---|---|
| MNIST test (these checkpoints) | 97.1% | 92.1% |
| Nonlinearity | Fixed on nodes | Learnable φ on edges |
| Inspectability | Post-hoc (Grad-CAM) | Intrinsic edge curves |
| What you optimize for | Speed + accuracy | Readable decision path |